Introduction
What is processing?
Processing is a flexible software sketchbook and a language for learning how to code within the context of visual arts. It's a platform that allows artists, designers, and beginners to create interactive visuals, animations, and simulations. With its simple and intuitive interface, Processing enables users to quickly prototype ideas and explore creative coding without getting bogged down in complex syntax. The Processing environment consists of a programming language (based on Java) and an integrated development environment (IDE). It's known for its accessibility, making it a popular choice for artists and designers who want to incorporate code into their creative work.
How to installed
- Choose your operating system: Click on the appropriate download link for your operating system (Windows, macOS, or Linux).
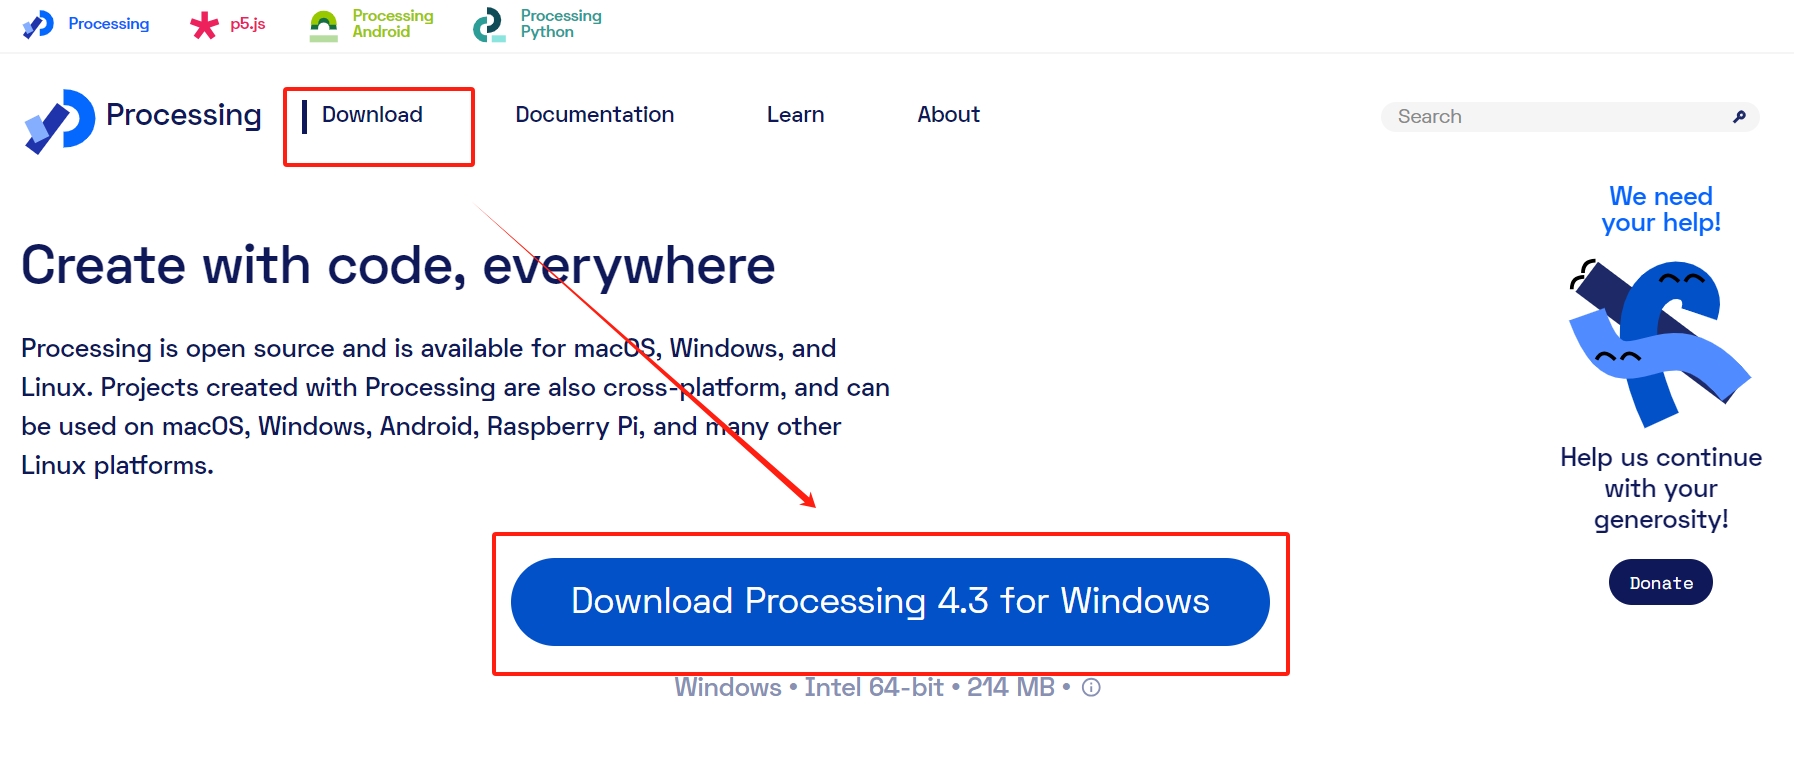
- Download Processing: Once you click on the download link, the installer file will start downloading.
- Install Processing:
For Windows: Once the download is complete, double-click the downloaded file (usually ending with .exe) to start the installation process. Follow the on-screen instructions to install Processing on your computer.
For macOS: Open the downloaded .dmg file. Drag and drop the Processing application into the Applications folder or wherever you prefer to keep your applications.
For Linux: The downloaded file will be in a .tar.gz format. Extract the contents and follow the instructions in the provided README file or documentation for installation steps specific to your Linux distribution.
Run Processing: After the installation is complete, you can launch Processing by finding it in your applications folder or by searching for "Processing" in the search bar/spotlight.
Features of Processing Programming Language
Processing offers several features that make it a popular choice for creative coding and visual arts projects:
- Simple Syntax: Processing uses a simplified version of Java, making it more accessible for beginners. Its syntax is easy to understand and learn, especially for those new to programming.
- Visual Output: It's designed for visual artists, allowing easy creation of visual output, including animations, graphics, and interactive designs.
- Interactive Environment: The integrated development environment (IDE) provides immediate visual feedback. Changes in code reflect instantly in the output window, making experimentation and prototyping seamless.
- Graphics Library: Processing comes with a powerful and straightforward graphics library that simplifies drawing shapes, images, and manipulating pixels. This library makes it easy to create complex visuals without needing intricate code.
- Community Contribution: The Processing community is vibrant and active, offering a vast collection of user-created libraries, examples, and tutorials. This wealth of resources helps users learn and expand their skills.
- Cross-Platform: Processing is available for Windows, macOS, and Linux, allowing users to develop and run their sketches on multiple operating systems without modification.
- Open Source: Being open-source, Processing encourages collaboration and allows users to modify the source code according to their needs.
- Hardware Interaction: It supports interaction with external hardware like Arduino, allowing users to create projects that involve physical computing and interaction with sensors, actuators, etc.
- 3D Graphics: While primarily focused on 2D graphics, Processing also offers 3D graphics capabilities, enabling users to create three-dimensional visualizations and animations.
- Exporting and Sharing: Projects created in Processing can be easily exported as standalone applications or applets, making it convenient to share work with others.
- These features collectively make Processing a versatile and user-friendly platform for artists, designers, educators, and anyone interested in exploring creative coding and visual arts.
Mouse and keyboard to change the color of a rectangle object and control its movement
Processing basic interaction design and operation based on mouse and keyboard using JAVA.
This simple game you have created allows you to interact with GUI programming in processing using your mouse and keyboard.
If you click the mouse, it will interact to change the color of the rectangle object and when you press the keyboard arrow keys it will move based on left-right-up-down.
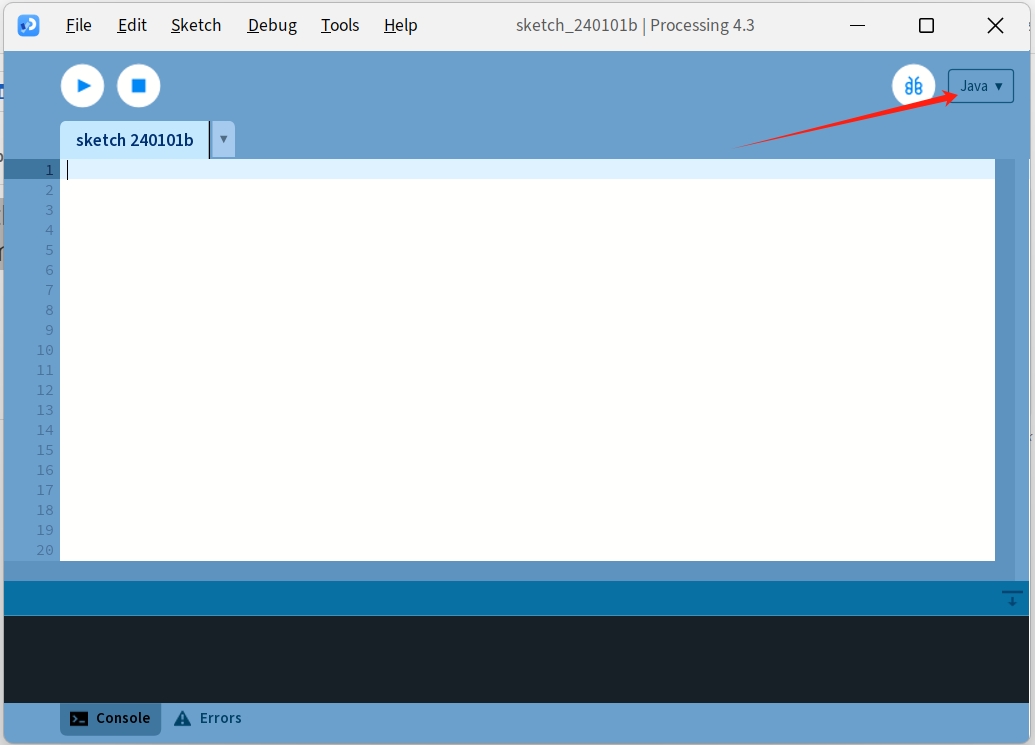
Select Programming Language Java
Code Explaining
- int x, y; //Declare two integer variables to store the shape's x and y coordinates.
- color rectColor; declares a variable to store the shape's color. void setup(){- Begins a function called one only at the start of program.
- Size (600, 400).-The canvas can be 600 x 400 pixels. You can give it as like your needs.
- x = width/2; - The X coordinate of the shape's initial position is set in half way across the canvas.
y = height/2; – The Y coordinate of the shape is set to half way up in the center. - rectocolor = color(255); //Sets the shape's color to white. void draw() -- Begins a drawing function that is called over and over to refresh the screen.
- background 200; - Light gray background.
- fill(rectColor) – Sets the fill color to the value stored in rectColor. rect (x, y, 50, 50) - Draws a box of length and width equal to 50 pixels at position (x.y).
- void keyPressed() { void Starting the function that runs if a keystroke is typed.
- if (keyCode == UP) { y -= 10; }; - Pressing the up arrow key lowers Y by 10.
- else if (keyCode == DOWN) { y += 10; }Pressing the down arrow key gives an increment of 10 to Y.
- else if (keyCode == LEFT) { x -= 10; } - If keyCode is the left arrow, decrement its value from that of x by 10.
- else if (keyCode == RIGHT){ x += 10; }; Pressing the right arrow key increases the x coordinate by 10.
- void mousePressed() { - Keyword - This function is called when the left button on the mouse has been pressed.
- rectColor = color(random(255), random(255), random(255));
The following code is a simple example of Java processing game that captures keyboard and mouse input. Let's try to understand each line of code.
So basically this code makes a simple game where you can control a box moving using keyboard Arrow and when you will click on this rectangle using your mouse it will change color.
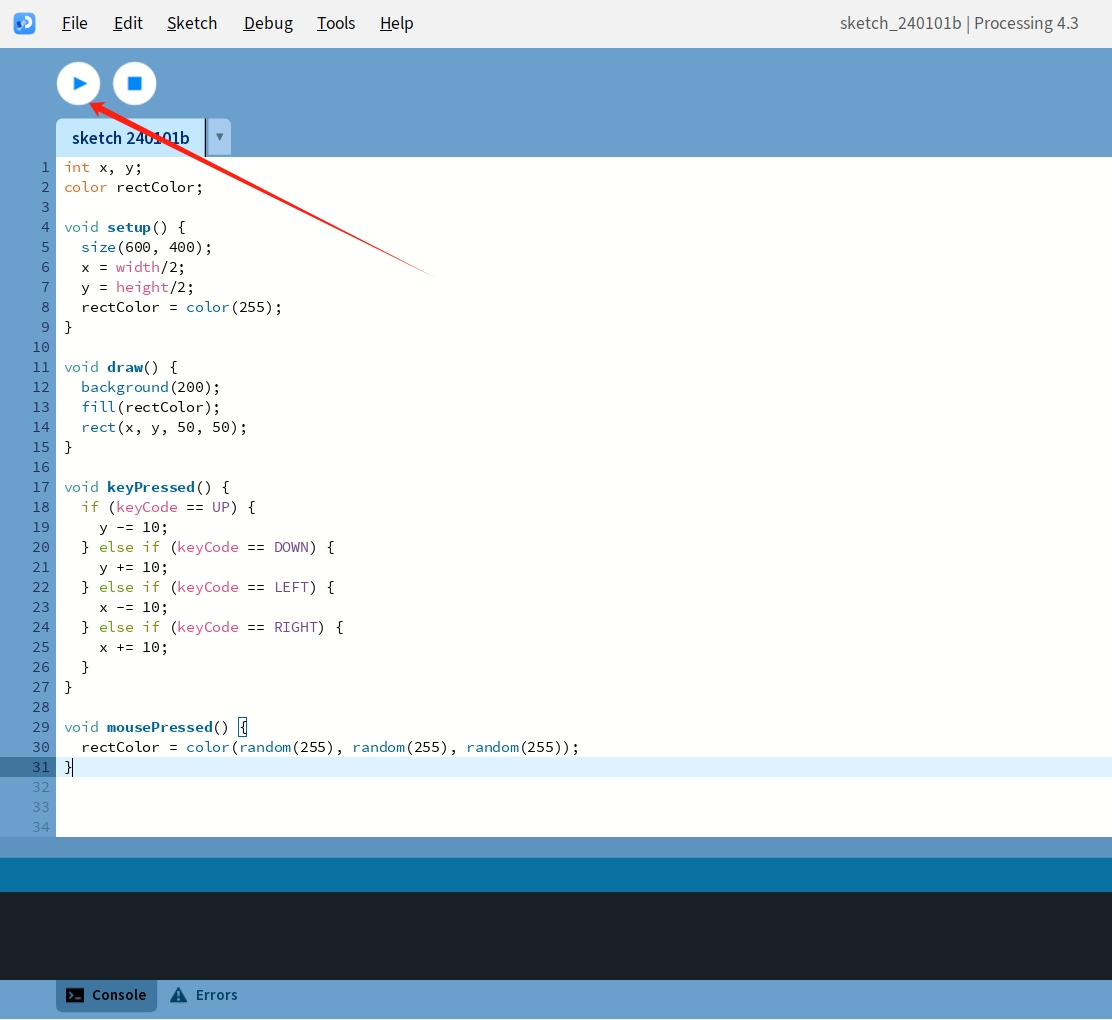
Run program
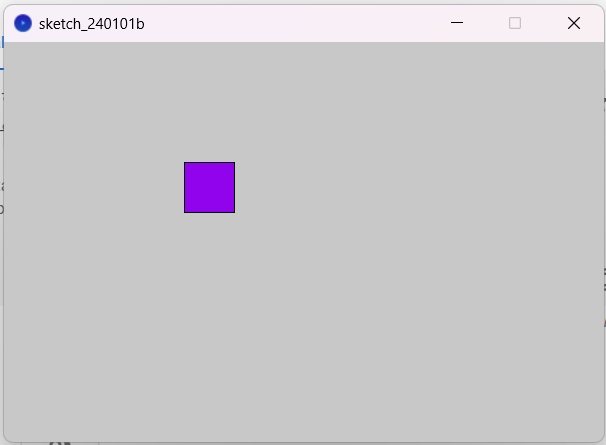
It will open a pop-up display. To change the color of the rectangle object, simply use the mouse. To control its movement, you can use the arrow keys on your keyboard - left, right, up, and down.
 Note:All reference links are in the reference section
Control Arduino with processing
Introduction:
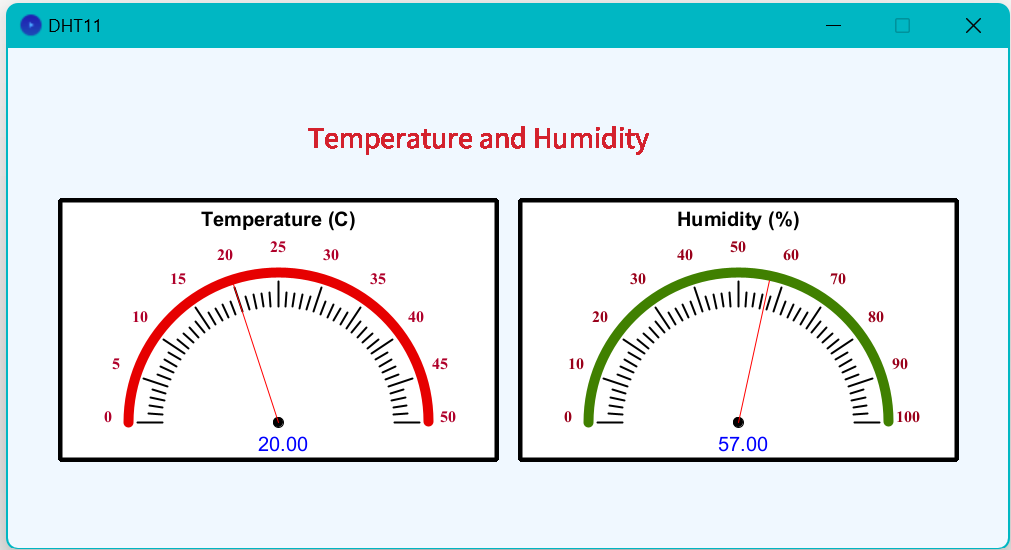
The project wants to make a picture user interface (GUI) for showing heat and wetness using an Arduino with DHT sensor in Processing. The screen will show live information from the devices. To do this, you'll
need an Arduino board, a DHT sensor and Processing software. The Arduino will link to the DHT sensor, and then send data to Processing. There a GUI is made for it. The Processing drawing will be changed to write down the
name of your serial port and its speed. This is based on how you have set it up. When you put the code on an Arduino and connect it to your computer, a Processing drawing can be used. It helps show how hot or humid things
are in real time using pictures as well. You can use the "meter" library in Processing to make a graphical interface. The project needs parts of the computer and rules that tell it what to do. The resources given show how
to put together the hardware part and write code for it.
- Arduino Nano
- DHT11 but you can use DHT22 or another sensor
- Breadboard
- Wires
- Arduino IDE
- Processing
- Low cost
- 5mA max current use during conversion (while requesting data)
- Good for 0-50°C temperature readings ±2°C accuracy
- Good for 20-80% humidity readings with 5% accuracy
- No more than 1 Hz sampling rate (once every second)
- Body size 15.5mm x 12mm x 5.5mm
Hardware required:
Hardware required:
Technical specification:
DHT11 Technical Specs:
DHT Pin configuration:
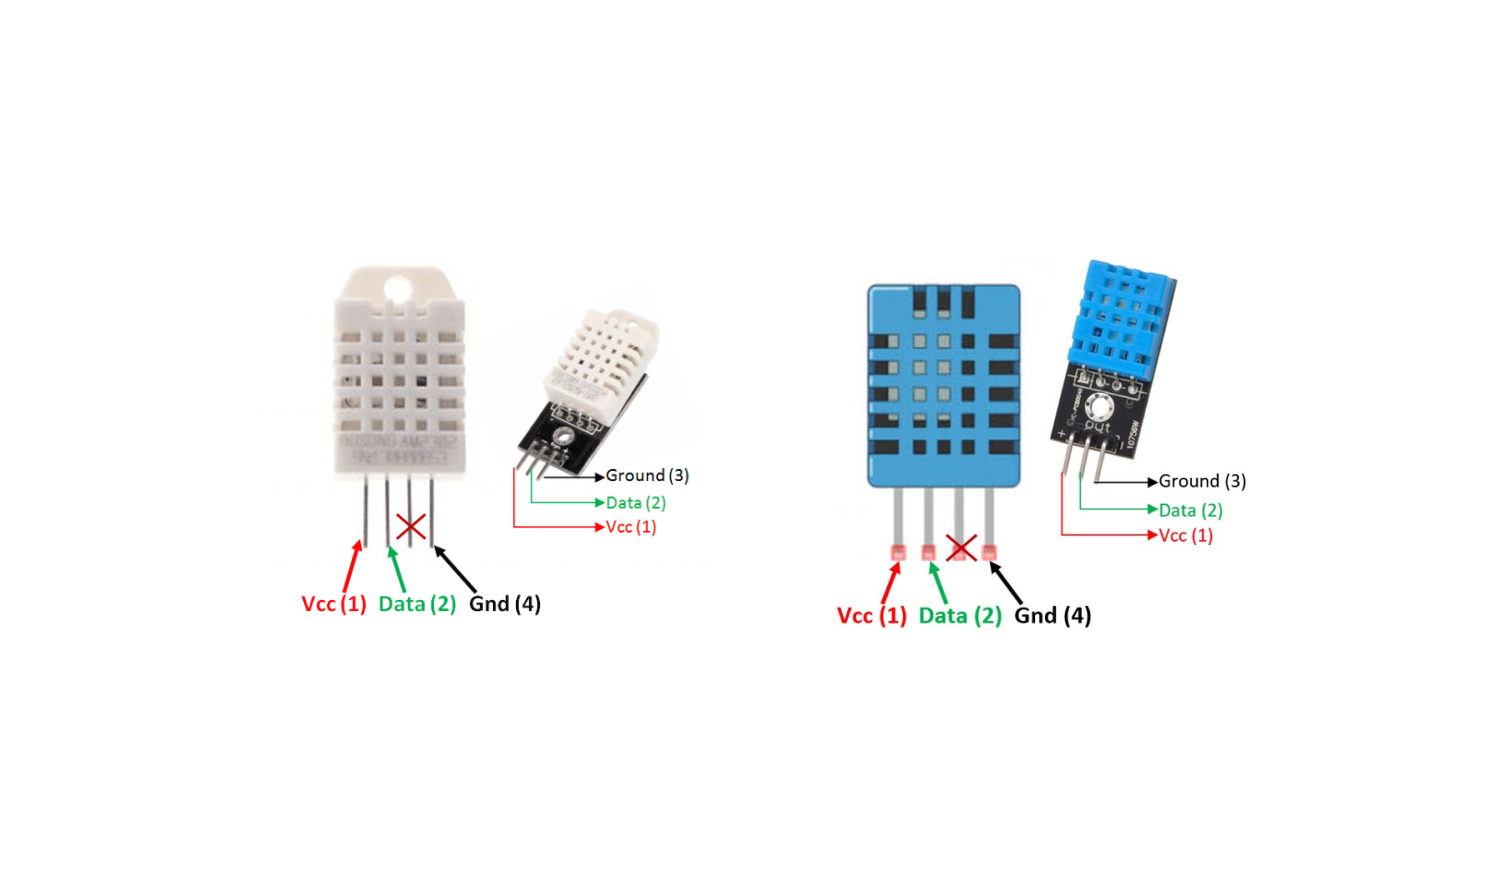
Component Picture
 To set up the hardware, you will need an Arduino board and a DHT sensor like DHT11 or DHT22. Also use things called breadboard and jumper wires for it. The sensor is linked to the Arduino as shown in the diagram found online. After setting up the hardware,
you need to write code on an Arduino so it can read data from a sensor. Then make a graphic User Interface in Processing that shows temperature and humidity values coming into your computer through the wires of our little helper
device called Arduino's serial port. In Processing, you have to add the "meter" library. This is simple: just go into the library manager and look for "meter", then install it. The code for the Arduino and Processing sketch
that shows temperature and humidity is in resources. It's made to show those values right away. This project doesn't need lots of knowledge about writing code, and the resources given walk you through step by-step on how to
make a user interface with things like Arduino and Processing for seeing temperature changes.
To set up the hardware, you will need an Arduino board and a DHT sensor like DHT11 or DHT22. Also use things called breadboard and jumper wires for it. The sensor is linked to the Arduino as shown in the diagram found online. After setting up the hardware,
you need to write code on an Arduino so it can read data from a sensor. Then make a graphic User Interface in Processing that shows temperature and humidity values coming into your computer through the wires of our little helper
device called Arduino's serial port. In Processing, you have to add the "meter" library. This is simple: just go into the library manager and look for "meter", then install it. The code for the Arduino and Processing sketch
that shows temperature and humidity is in resources. It's made to show those values right away. This project doesn't need lots of knowledge about writing code, and the resources given walk you through step by-step on how to
make a user interface with things like Arduino and Processing for seeing temperature changes.
Arduino Code::
open Arduino IDE
Download meter from library as you can see in the picture below:
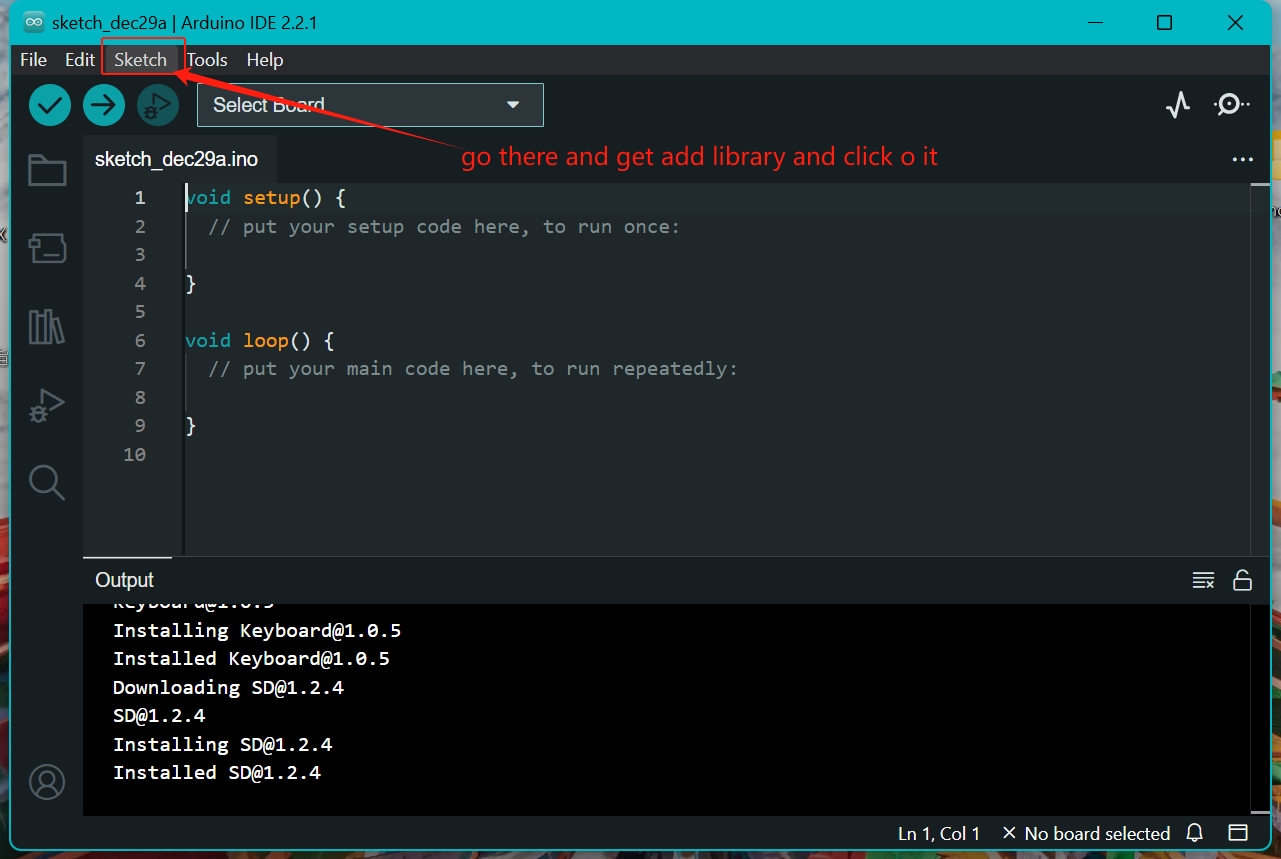
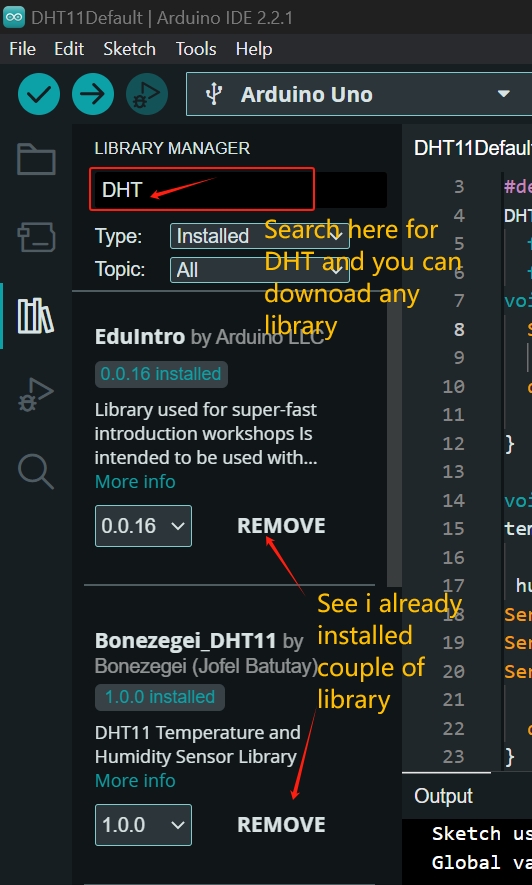
By following this step you can download our required library for DHT11 or DHT22 according to your sensor
By following this step you can download our required library for DHT11 or DHT22 according to your sensor
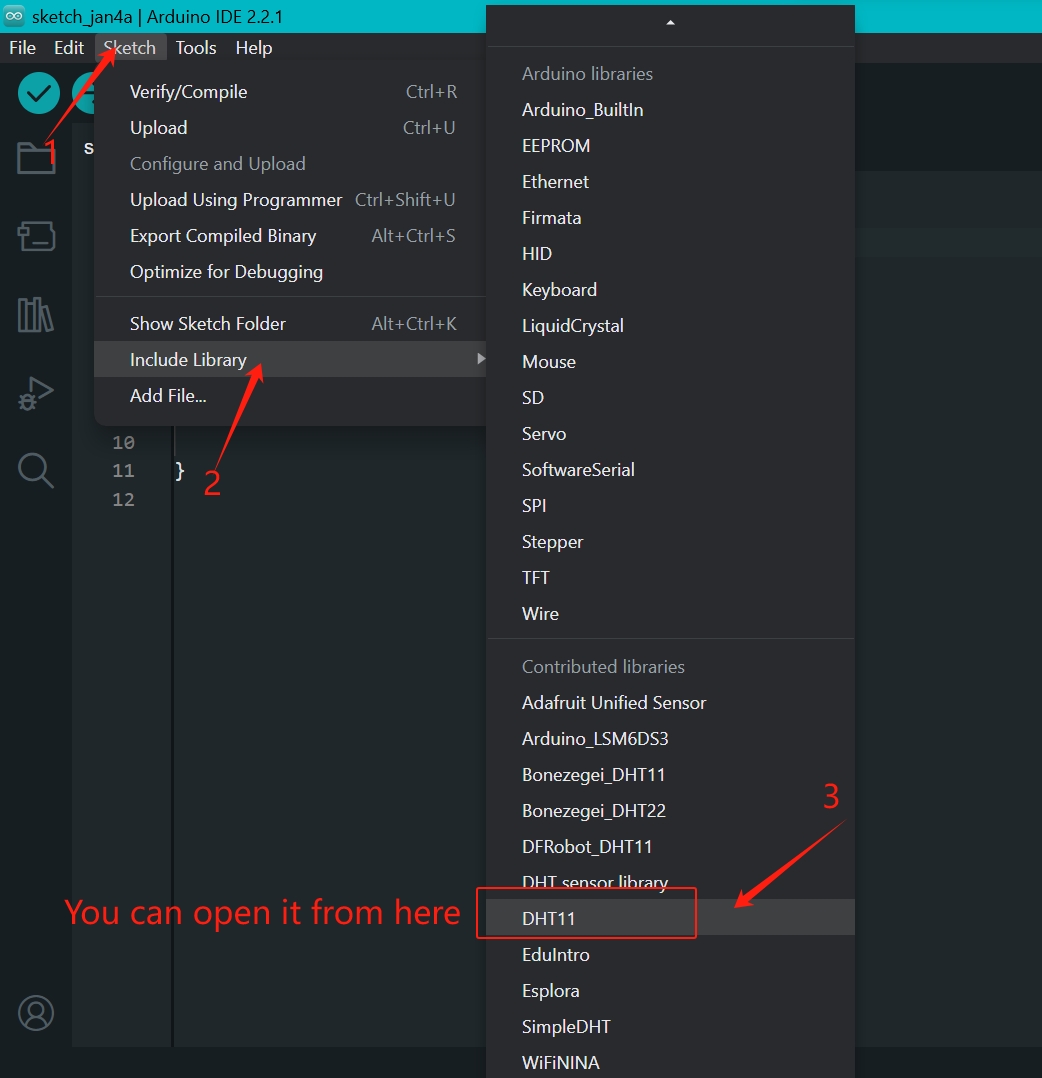
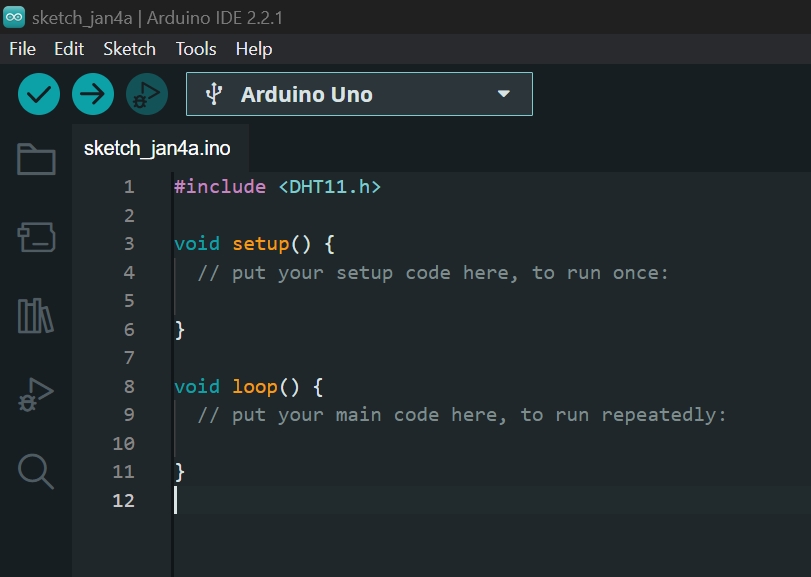
After open the DHT default environment you need to change couple of things as you see in the picture below or you can check the code from code section.
This Code for Arduino to configure the hardware after that we need to write processing code for GUI visualize the data on our laptop screen. In my case i’m using java language in my processing part. I’m given everything below step by step :
Arduino Code:
open Arduino IDE
Download meter from library as you can see in the picture below:
Processing Code:
Open Processing
Download meter from library as you can see in the picture below:
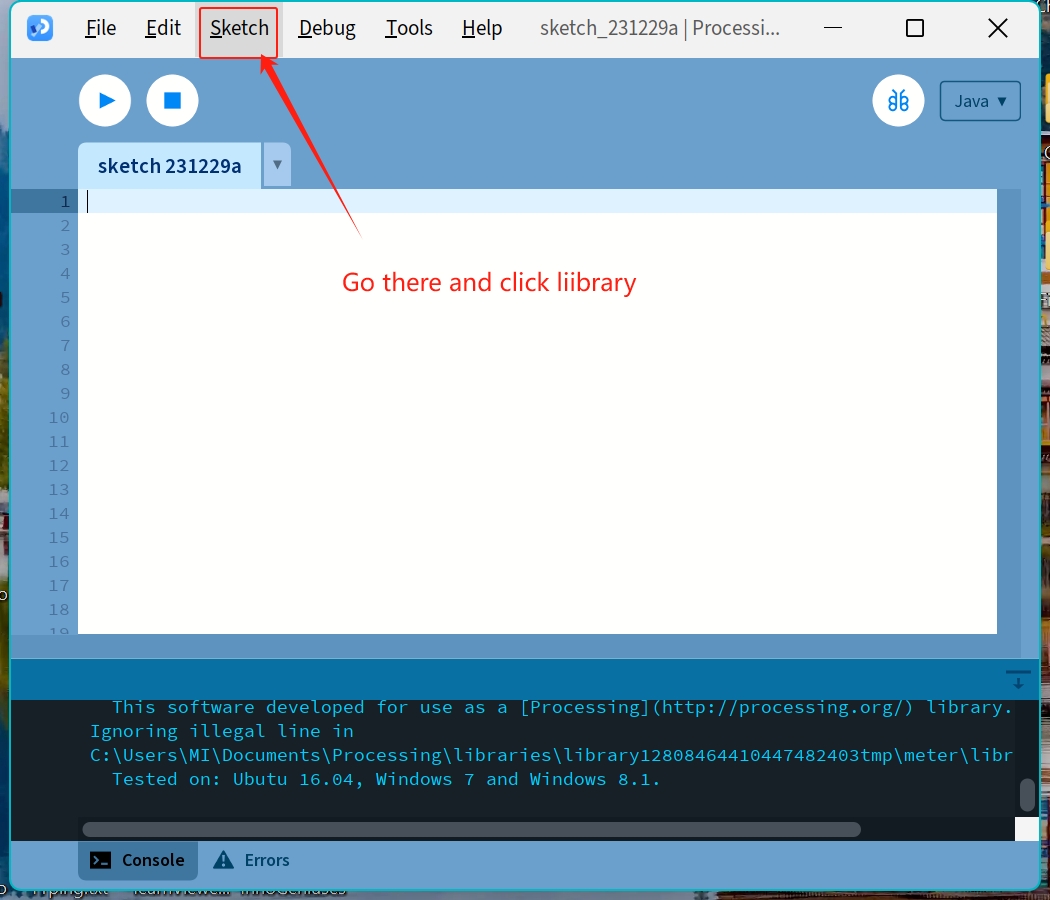
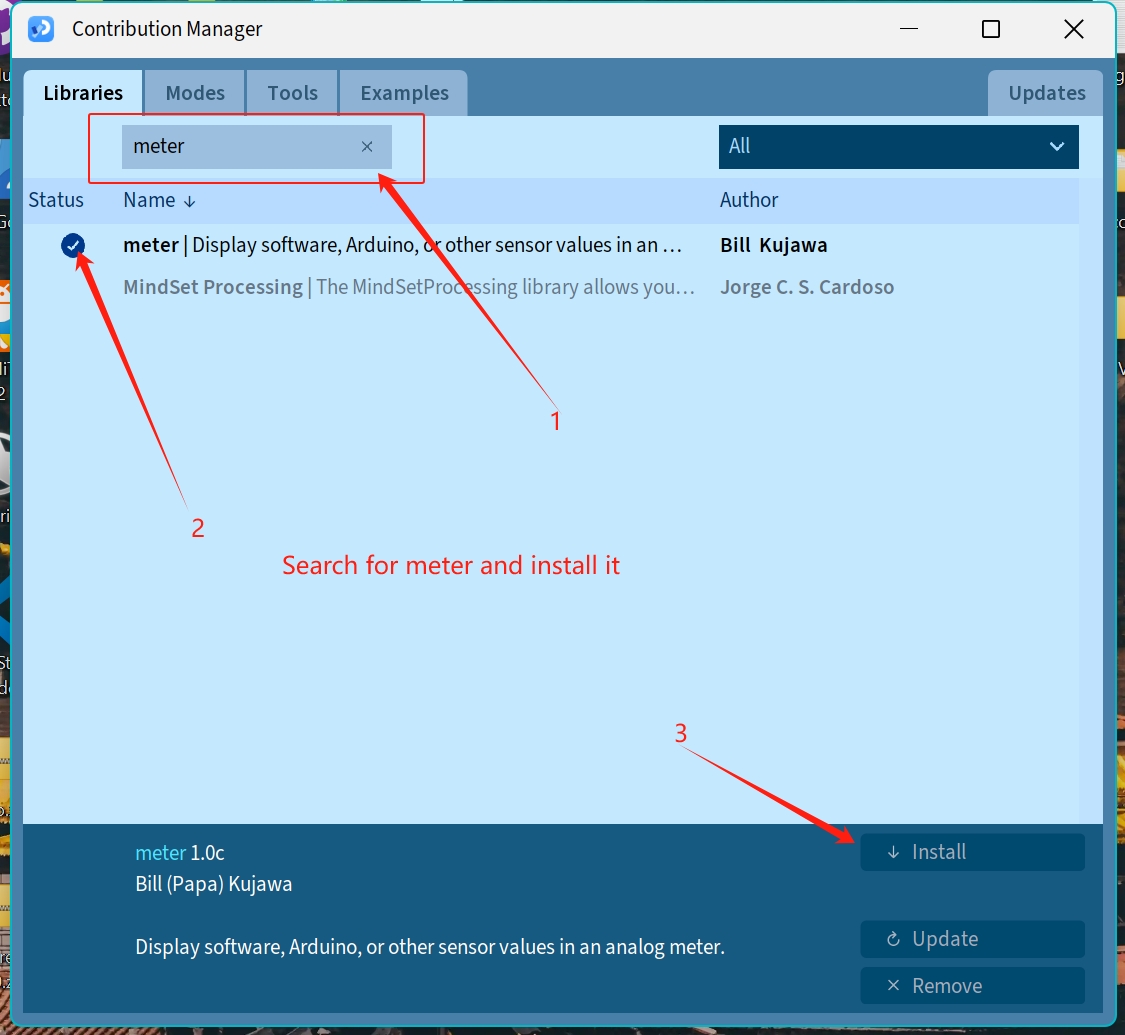
After successfully installed the Meter library we can write some code to make meter and get data from our Arduino. You can follow our code :
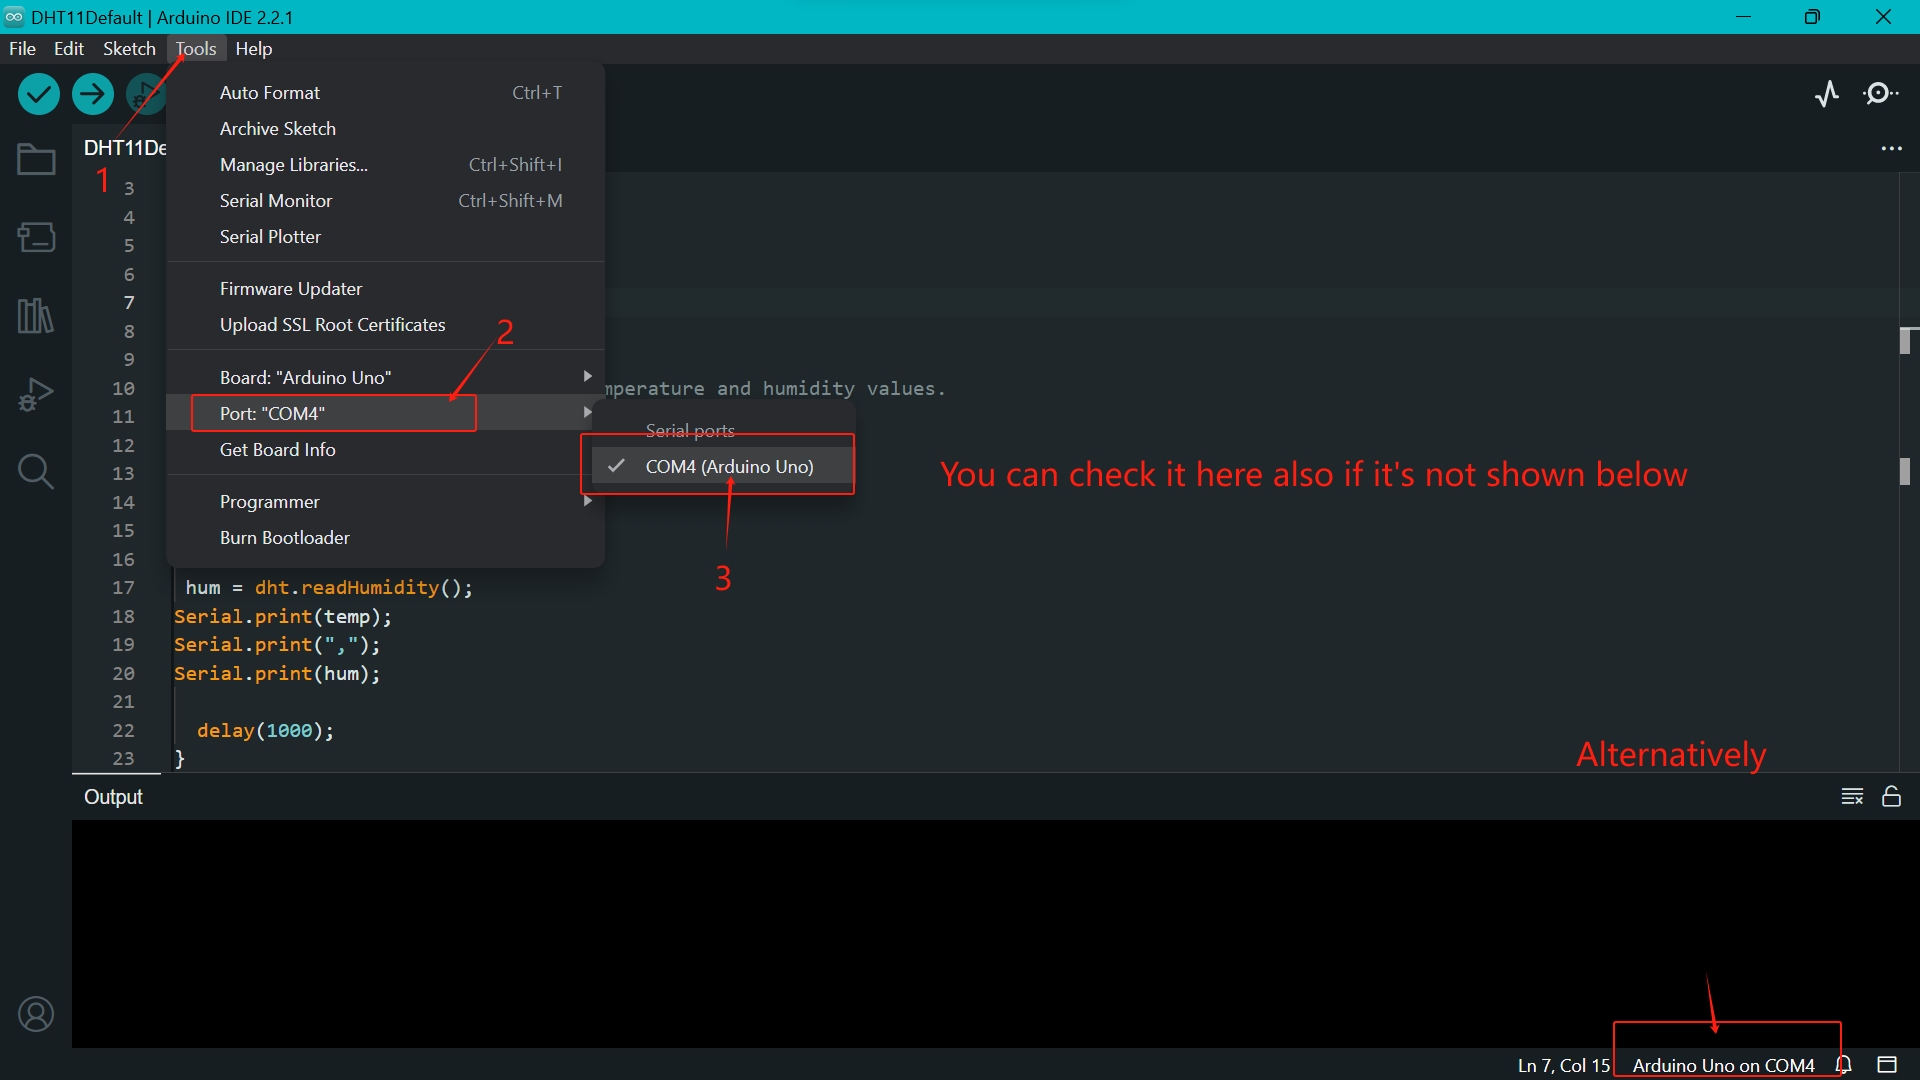
This code is written for DHT11 You can also try DHT22 , it might work for both sensor. You can see the code and you will understand , cause i’m given comment beside of my codes. But remember that to change th e port name according to your Arduino port. You can check it from your Arduino IDE in tools section . Or you can follow the below picture.
Hardware Setup:
We finished all the code we need. Now, we can setup hardware and run the code. I already mentioned all the required hardware above but for your help i will give the real field picture below:
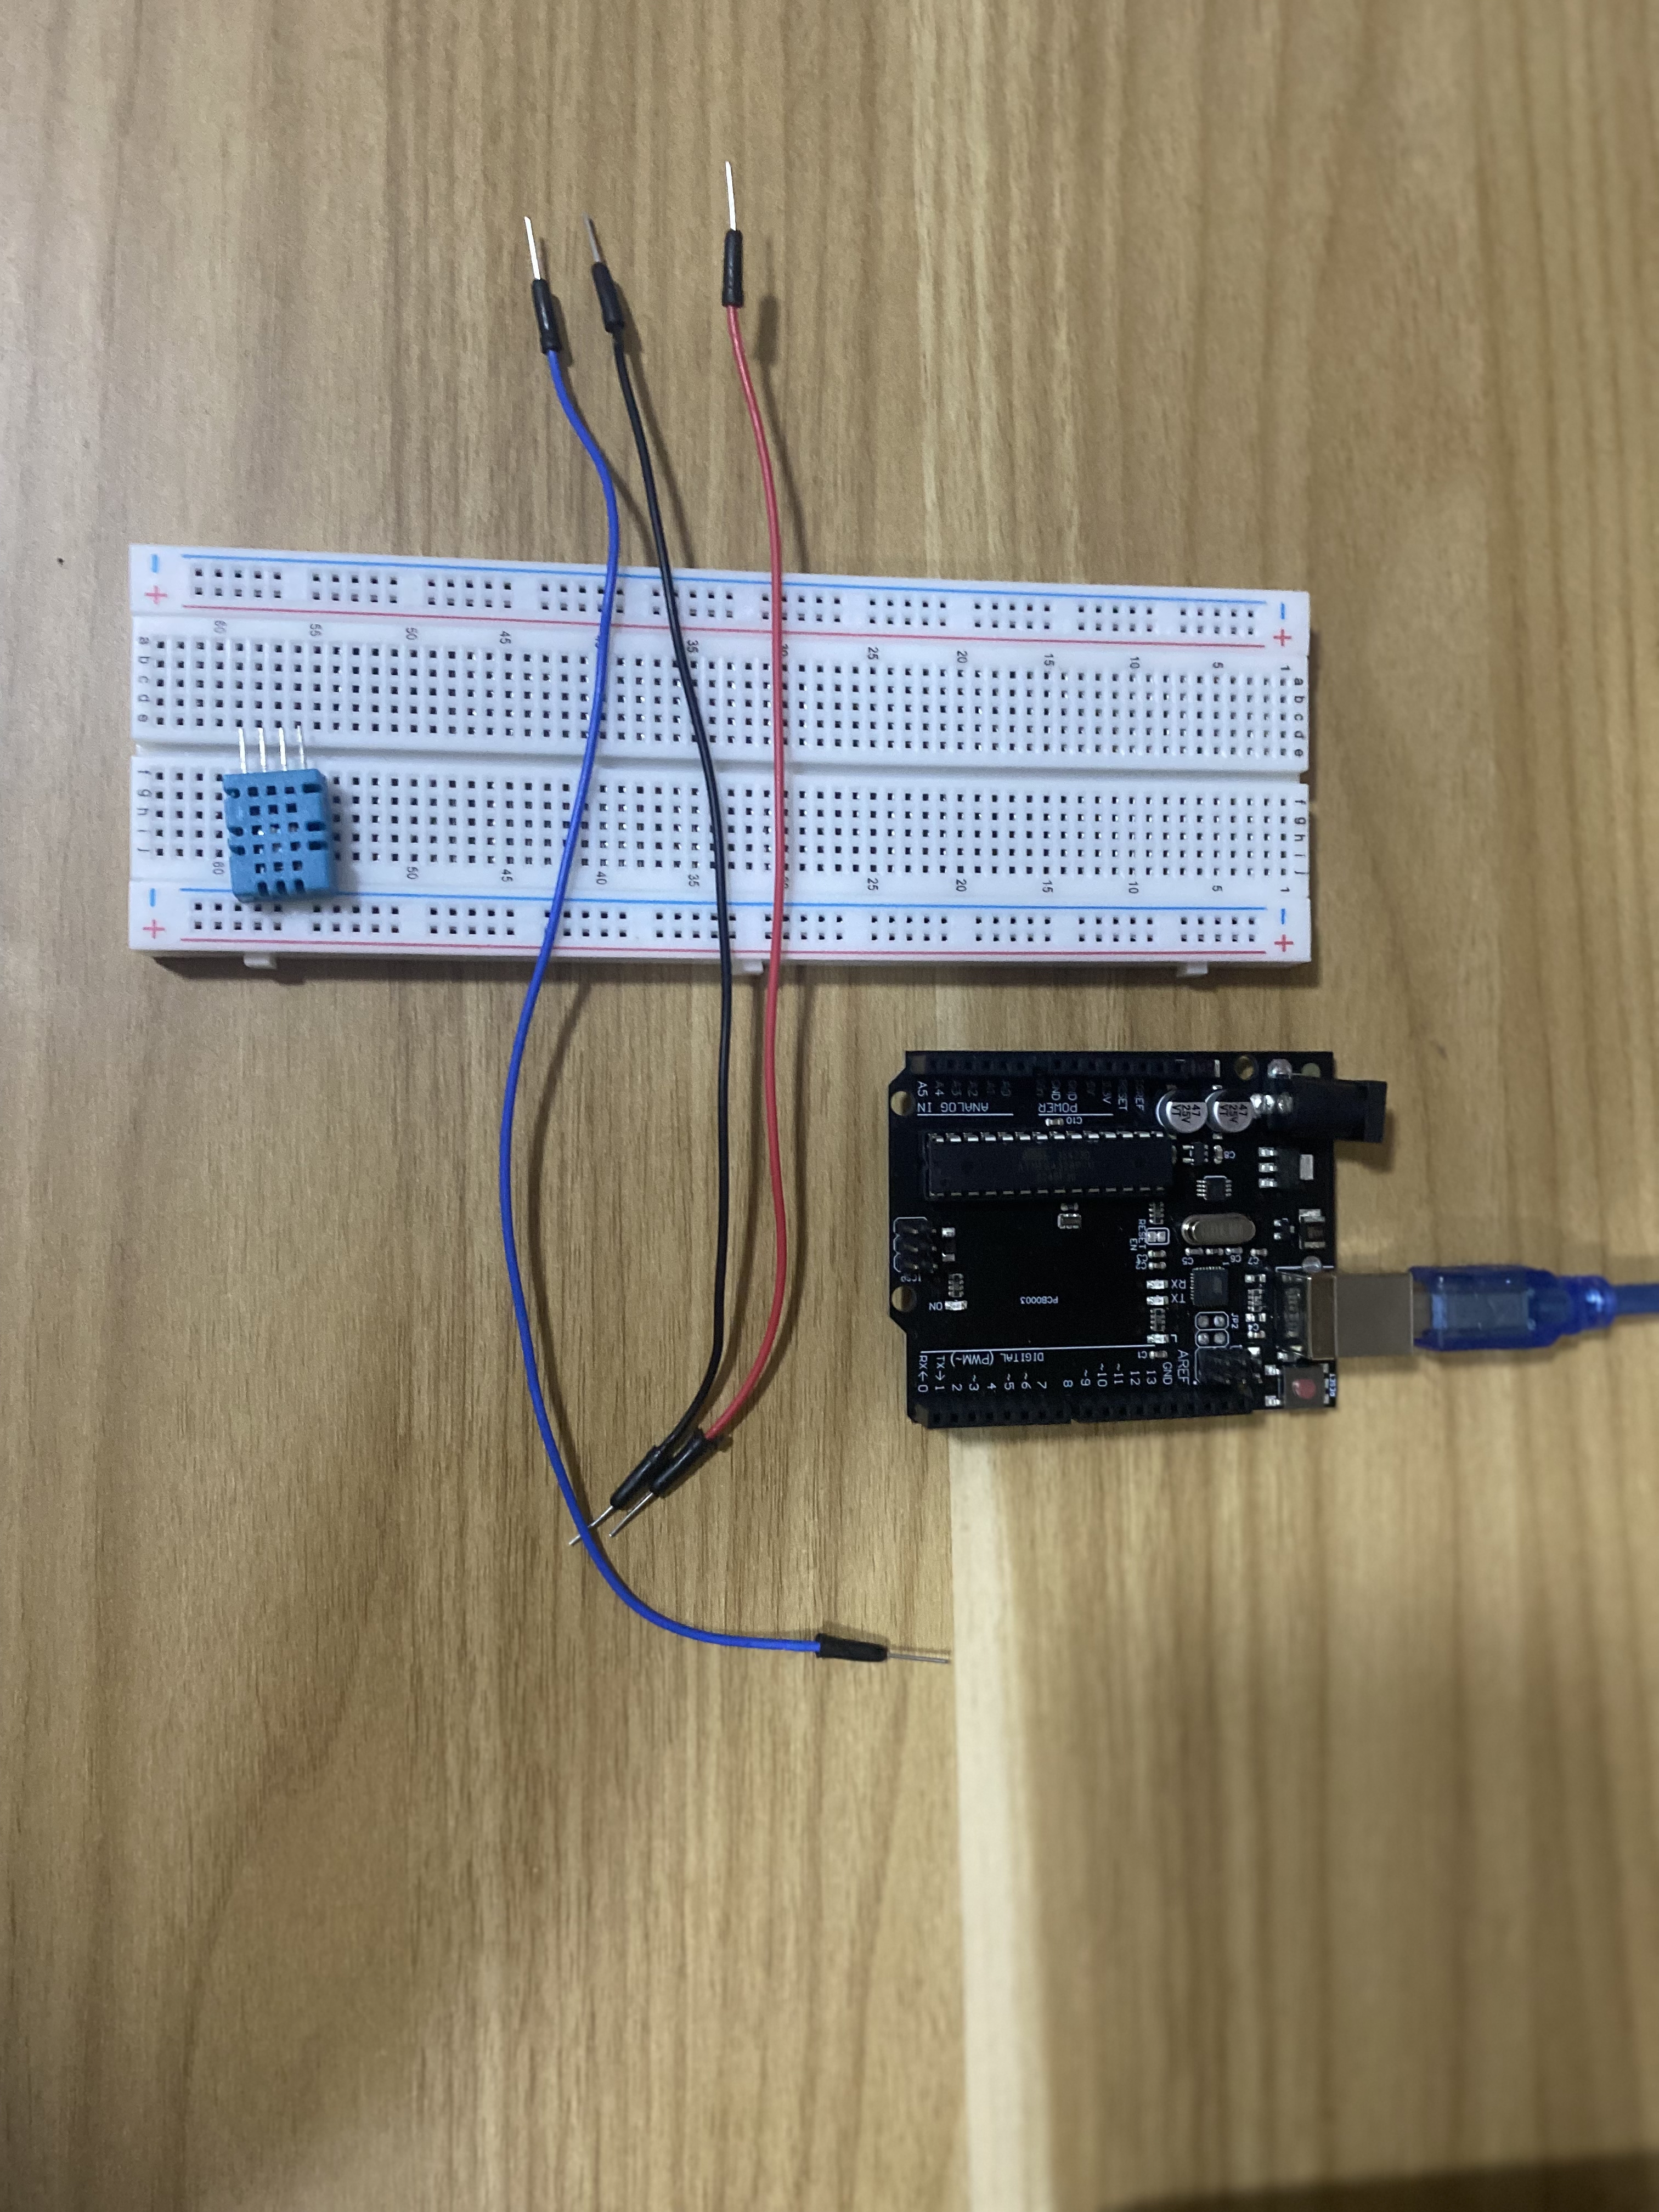
Here is the basic hardware we need. [DHT11,Breadboard,3 wires, Arduino Uno]. In your case you can replace hardware like DHT22 and Arduino Nano. No let’s connect the wires according to the picture.
- 1st wire should be Vcc[5v/3.3v]
- 2nd wire connect with Pin 2 [Arduino Uno] / D2 [Arduino Nano
- 3rd wire no connection
- Last pic will connect in GND
All the setup is done , Now time to connect your Arduino device with your laptop or Desktop whatever you use. And you can follow the video below for real time practical demonstration.
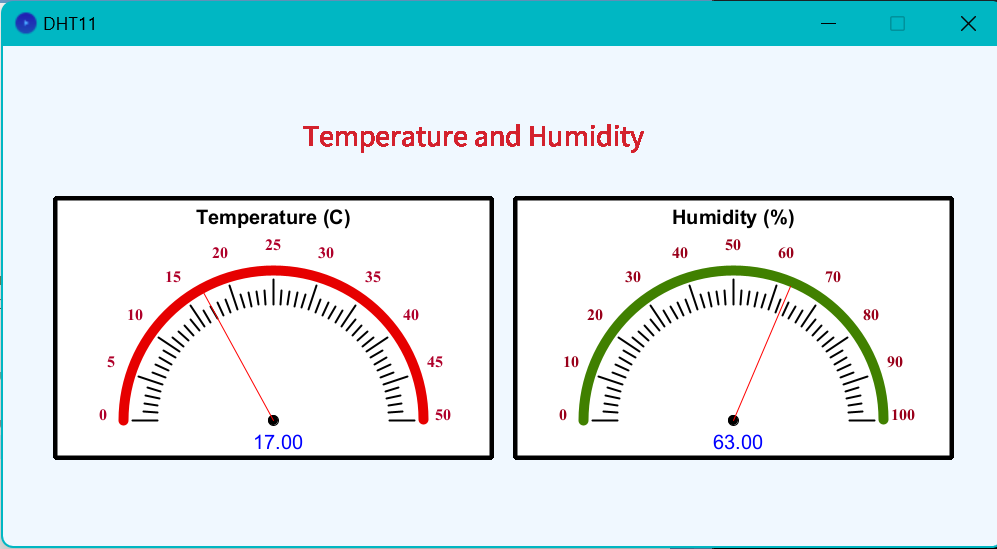
I'm going to tell you how the circuit schematic works, which connects everything. I will explain it in a minute. I have used a USB cable to connect my Arduino board with my laptop. I started the Processing software when I connected
Arduino to my laptop. I just needed to press the play button for the code to start working. Right now, the heat measurement, Humidity level readings are shown on dials.
I then heated the DHT11 Temperature and Humidity Sensor by myself using a glass of Hot water as you see in the video. The DHT11 is a very slow sensor; it needs time to update the values. The needle on the meter started
to shift after I kept using heat on the sensor for almost ten seconds. I was really happy in that moment. Then, since I was using a 2000 millisecond break in the Arduino code.
Reference
- https://www.nexmaker.com/doc/11Interface-application-programming/processing.html
- https://www.hackster.io/hardikrathod/create-gui-to-visualize-temp-and-humidity-for-arduino-85a7aa#toc-circuit-4
- https://www.electroniclinic.com/arduino-sensor-values-on-gauges-designed-in-processing-software-sensors-dashboard/
- https://www.nexmaker.com/doc/11Interface-application-programming/processing.html
- https://github.com/FastLED/FastLED
- https://github.com/rwaldron/johnny-five