
Fifth, We Begin to Visualize Our Musical Interactions Using PROCESSING.
Article Catalog
- Processing Experiment - Music Visualization
- Processing with Arduino - Control Visualization
- Processing Advanced Experiment
- New Tool Introduction - NodeBox
Processing Experiment - Music Visualization
01 Overview
The objective of this experiment was to create an interactive music visualization demonstration using Processing 4.3. By writing code, we aimed to generate visual effects related to the rhythm of the music while it plays. This experiment was designed to demonstrate how audio data can be transformed into visual art and to explore the interactive relationship between music and visual arts.
02 Materials
- Software: Processing 4.3
- Library: Minim library, used for audio processing
- Music File: Any mp3 format music file, here we chose the song “Thirsty” by the girl group aespa as our demonstration music
03 Process
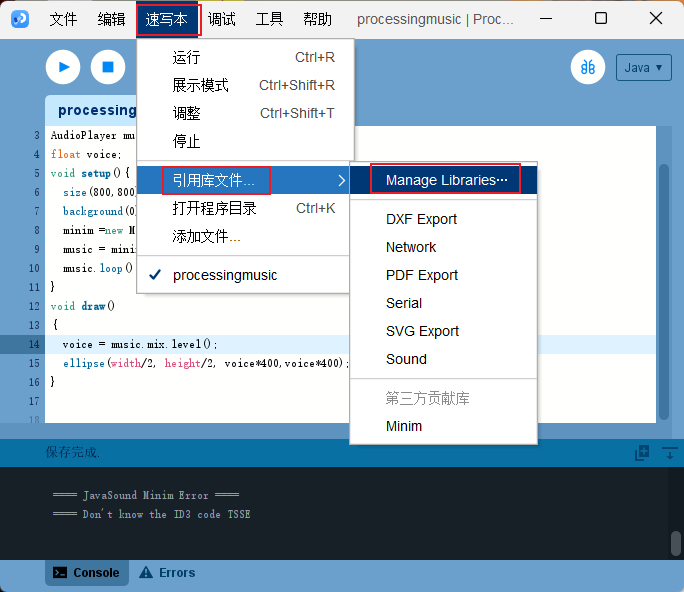
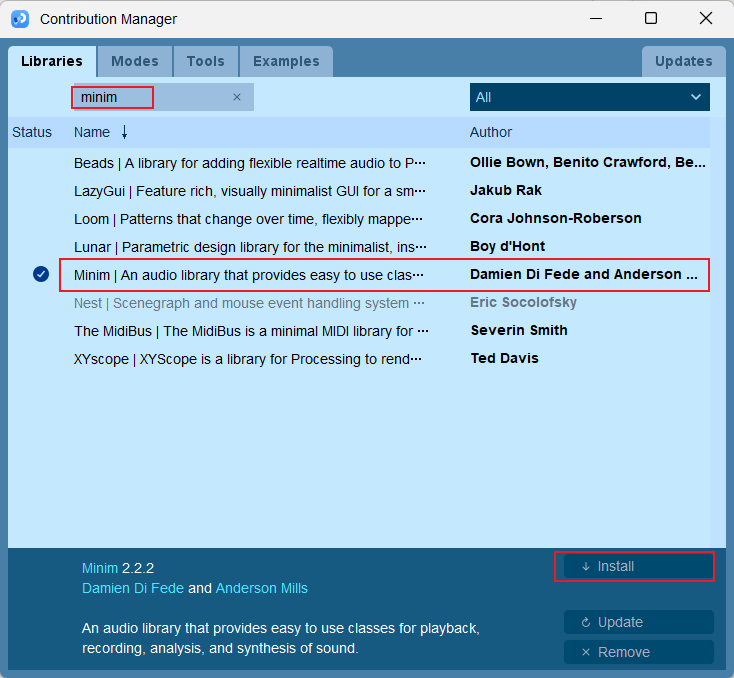
Installing Minim Library: Install the Minim library via “Sketch” > “Import Library…” > “Manage Libraries”, search for “minim” and select to download.
Environment Setup: Initialize the Processing environment and set the canvas size.
Audio Processing: Load the music file using the Minim library and loop it.
Visualization Display: Dynamically draw circles of varying sizes at the center of the screen based on the sound wave level of the music.
The code and comments for this experiment are as follows:1
2
3
4
5
6
7
8
9
10
11
12
13
14
15
16
17
18
19
20import ddf.minim.*; // Importing the Minim audio library
Minim minim; // Declaration of Minim object
AudioPlayer music; // Declaration of AudioPlayer object
float voice; // Variable to store the audio level
void setup() {
size(800, 800); // Setting the size of the canvas
background(0); // Setting the background color to black
minim = new Minim(this); // Initializing the Minim object
music = minim.loadFile("music.mp3", 1024); // Loading the music file
music.loop(); // Playing the music file in a loop
}
void draw() {
voice = music.mix.level(); // Retrieving the audio level
// Drawing an ellipse at the center of the canvas
// The size of the ellipse is based on the audio level
ellipse(width / 2, height / 2, voice * 400, voice * 400);
}
04 Achievement Display
- Music Playback: The music file was successfully loaded and played in a loop.
- Dynamic Visual Effect: The level of sound waves in the music affected the size of the circles, achieving a dynamic visual change.

05 Summary
Through this experiment, we successfully combined audio data with visual elements, creating a new form of artistic expression. This not only showcased the application of programming in artistic creation but also laid a foundation for further exploration of the interaction between music and visual arts.
Processing with Arduino - Control Visualization
01 Experiment Overview
The purpose of this experiment is to explore how to utilize Arduino and Processing to work together to control the size of a square cube on the Processing interface through the touch sensor on the Arduino. The core of the experiment is to realize the data communication and interaction between the two platforms. When a finger touches the sensor, the Arduino sends a signal to Processing to make the square on the screen larger; when there is no touch, another signal is sent to make the square smaller.
02 Materials
- Arduino UNO Development Board
- Touch Sensor
- Software: Processing 4.3
- Software: Arduino IDE
- USB cable
- Dupont Cable
03 Experimental process
1.Hardware Connection: Connect the touch sensor to the Arduino board. the Arduino connection circuit diagram is shown below.

2.Programming Arduino: Write code to enable it to detect the state of the touch sensor and send the state (1 or 0) through the serial port.
Below is the code for the arduino part:
1 | int touchPin = 3; // 定义触摸传感器连接的引脚 |
3.Programming Processing: Write Processing code to receive data from Arduino and change the size of the square on the screen according to the data.
The following is the code for the Processing part:
1 | import processing.serial.*; |
Note that in the code for both the Arduino and Processing, you need to keep the same ports connected/reading on both sides, so that Processing can read the data fed back from the Arduino properly.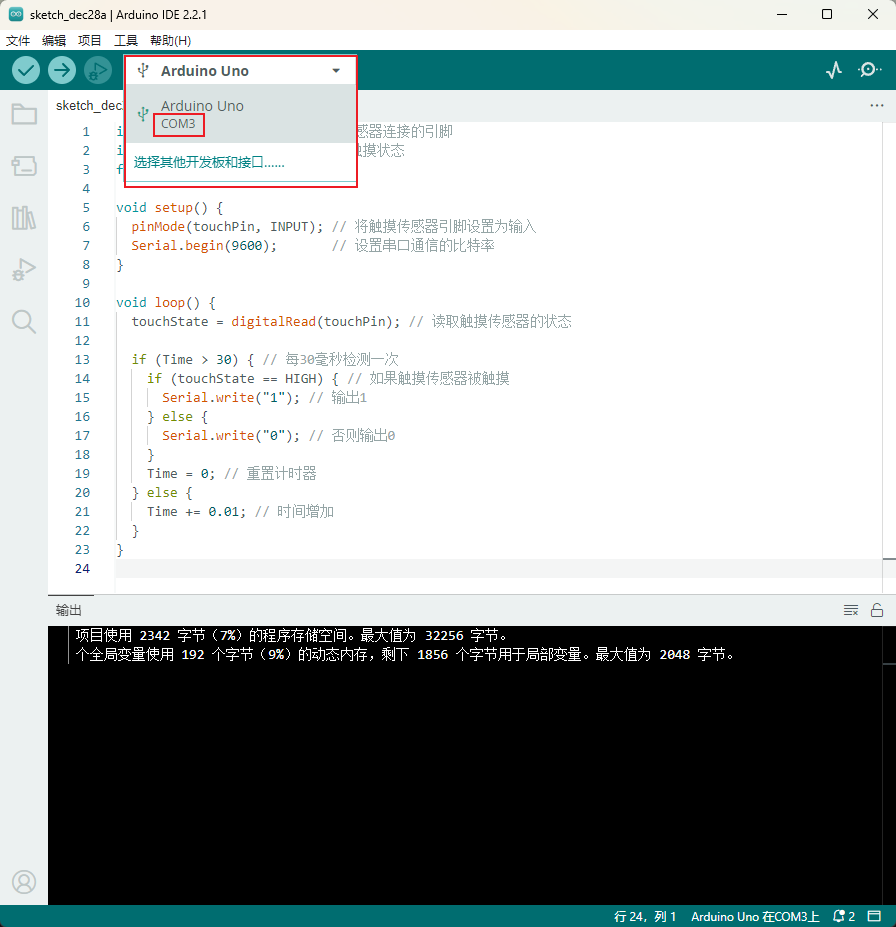

4.Testing and Debugging: Connect the Arduino to the computer, run the Processing program, and test the effect of the touch sensor to control the size of the square, and adjust it if necessary.
Through the Arduino’s serial monitor, you can observe whether the Arduino can feed back data correctly.
When connecting Processing for testing, you need to turn off the Arduino’s serial port monitor, otherwise there may be a problem with the COM3 port being occupied, causing Processing visualization to fail.
04 Demonstration of results
Below are screen recordings and videos that show how the square changes with the state of the touch sensor. Two states are included: touch sensor (square gets bigger) and untouched sensor (square gets smaller).

05 Summary
The experiment successfully demonstrated the interaction between the Arduino and Processing, proving that graphical interface elements can be effectively controlled by a simple touch sensor. This interaction provides a basis for the possibility of more complex projects in the future, such as the creation of more sophisticated user interfaces or the development of interactive artworks.
Processing Advanced Experiment
The specific production process of the experiment and the demonstration of the results can be found by clicking the following link, and we have uploaded a video of the whole experiment process.
https://www.bilibili.com/video/BV1ce411D7rg/?spm_id_from=333.999.0.0&vd_source=ba7dc2f33aa076b749012d4df45343cc
01 Experiment Overview
The purpose of this experiment is to create an audio visualization player through the Minim library of processing. This player can not only play music, but also display the spectrum and waveform of the music with visual effects, so as to achieve the combination of vision and hearing.
02 Experimental procedure
- Environment Setup: Install Processing software on your computer and make sure the Minim library is downloaded.
- Code writing: Use java library to write the code. The code includes setting up the canvas, loading music files, FFT analysis, and drawing the audio spectrum and waveform in the
drawfunction. Here we have borrowed the help of chatgpt to complete the code. - MUSIC FILE HANDLING: Place the music files in the project directory to ensure that the code loads the music correctly.
- Test Run: Click Run to see the effect.
- Debugging and Optimization: Make adjustments according to the actual effect to optimize the visual display.
The experimental code is as follows:
1 | import ddf.minim.*; |
03 Show results
The result of the experiment is an interactive audio visualization player. Users can control the play and pause of music by clicking the interface. The player displays the spectrum and waveform of the music in real time, with the spectrum appearing as colored circles and the waveform as yellow bars and circles. These visual elements dynamically change with the tempo and frequency of the music, providing a unique music experience.
Summary
With this experiment, we have successfully implemented an audio visualization player. This project not only shows how to transform audio data into visual images, but also demonstrates the power of Processing in multimedia applications. In this way, we are able to understand the structure and rhythm of music more intuitively, which leads to a richer listening experience. In addition, this project also provides practical reference value for the fields of music production and audio analysis.
New Tool Introduction - NodeBox
01 Introduction
NodeBox is a node-based software application for generative design. It’s built from the ground up by designers to be easy-to-use, efficient, and fast. NodeBox makes it easy to do data visualisations, generative design and complex production challenges.
NodeBox is actually a visual functional progamming language. It is inspired by a number of textual functional programming languages, notably Clojure and Haskell.
In functional programming, the functions take a central role, transforming data from one representation to the next.
Note that in NodeBox, we haven’t really talked about classical object-oriented programming constructs such as classes and objects. Instead, the objects of NodeBox are really holding places for data. The functions take in the data and generate new data.
Internally, nodes have a reference to a function: a piece of code written in Java, Python or Clojure.
NodeBox official website:
https://www.nodebox.net/node/
02 How NodeBox Works
NodeBox uses a different model from traditional applications such as Photoshop or Illustrator. Imagine an assembly line of workers. Each worker does one thing, and one thing only. After he or she has done their operation, the object is passed on to the next person who does his thing.
In the NodeBox assembly line nodes are the workers. They are the basic building blocks of the application.
By connecting nodes together, you create your own assembly line where a new shape goes in and a complex result comes out. Every step along the way can be changed and animated.
Here’s an example:
1.We create a rect node. This node is a generator: it generates a new shape.
2.We connect a colorize node to the rect node. This node takes the output of the rect node and changes its color. We call it a filter node, since it filters an existing shape.
3.Finally we create a rotate node and connect it to the color node. It takes the output of the color node and changes its rotation. This is also a filter node, it filters the colored rectangle node.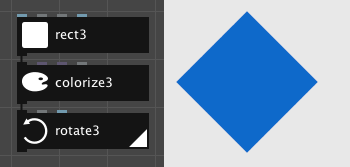
We can examine what each worker node is doing by changing the rendered node. The rendered node is the one that’s displayed in the viewer. You can render a node by double-clicking it.
03 Functions
Visualize Your Data
Because of its unique approach, NodeBox is ideal for rapid data visualization. NodeBox can import many data formats such as Excel spreadsheets and you can write your own data importers and exporters.
An Animated Partner
Every parameter in NodeBox can be animated. Animations can be exported as common movie formats or as a sequence of images.
A Friendly Face
You want to explore generative design without learning the ins and outs of programming? Using its node-based interface, NodeBox makes generative design easy and fast.
Peek Under The Hood
Using nodes doesn’t have to mean giving up expressive power. NodeBox makes it easy to customize the functionality of existing nodes or to build your own from scratch.
References:
https://processing.org/examples
https://openprocessing.org/
https://www.bilibili.com/video/BV1Pa4y1x7bp
https://www.bilibili.com/video/BV17s4y1H7mw/?spm_id_from=333.337.search-card.all.click&vd_source=ba7dc2f33aa076b749012d4df45343cc
https://www.bilibili.com/video/BV1p54y1r7dT/?spm_id_from=333.337.search-card.all.click&vd_source=ba7dc2f33aa076b749012d4df45343cc
https://openprocessing.org/sketch/2078020
https://www.nodebox.net/node/
https://www.nodebox.net/node/documentation/concepts/concepts
https://zhuanlan.zhihu.com/p/665313161
https://zhuanlan.zhihu.com/p/551966683